DETECTION OF THERMAL PANELS ON CANTON TERRITORY TO FOLLOW RENEWABLE ENERGY DEPLOYMENT
Nils Hamel (UNIGE) - Huriel Reichel (FHNW)
Supervision : Roxane Pott (swisstopo)
Project in collaboration with Geneva and Neuchâtel States - TASK-TPNL
July 2021 to February 2022 - Published on February 22, 2022
This work by STDL is licensed under CC BY-SA 4.0![]()
![]()
![]()
Abstract: Deployment of renewable energy becomes a major stake in front of our society challenges. This imposes authorities and domain expert to promote and to demonstrate the deployment of such energetic solutions. In case of thermal panels, politics ask domain expert to certify, along the year, of the amount of deployed surface. In front of such challenge, this project aims to determine to which extent data science can ease the survey of thermal panel installations deployment and how the work of domain expert can be eased.
Introduction
For authorities, being able to track the deployment of renewable energy is becoming a major challenge in front of stakes of our societies. In addition, following the deployment of installations on territory is difficult, as construction permits are not sufficient evidences. Indeed, the construction permits materialize a will, but the actual deployment and its specifications can differ from paperwork to reality. In case of thermal panels, domain experts are then put in front of a major challenge, as they have to certify of the surface of solar thermal energy that is deployed and active on their territory on a regular basis. This reporting is made for politics that aim to deploy a certain amount of renewable energy, part of territories energetic politic.
Mainly based on paperwork, the current survey of thermal panels deployment are affected by drawbacks. Indeed, it is currently complicated to determine whether a construction permit lead to the deployment of a thermal panel installation and if this installation is still in activity. The goal of this project is to determine if data science is able to provide new solutions for the survey of thermal energy production in order to report more accurate surface values to the politics.
Research Project Specification
In this project, the goal is to determine whether it is possible to track down thermal panels installation on territory by using aerial images and deep learning methods. The main axis are :
-
Train a deep learning model on aerial images to detect thermal panels
-
Assess the performances of the deep learning model
-
Determine to which extent it is possible to link the predictions to existing domain expert database
Research Project Strategy and Collaboration
This research project was made in collaboration with the States of Neuchâtel and Geneva. Both domain experts are facing similar challenges and their needs are nearly identical, despite their current processes differs. For each collaboration, the goals are similar, but the methodology is different. With Neuchâtel, the domain expert database is considered while with Geneva, the database is not considered.
Considering the database in the collaboration with Neuchâtel lead to a much larger amount of work, as the database need to be pre-processed before to put it into perspective of the deep learning network results. It is nevertheless important to be able to assess the possibility to insert our demonstrator in the existing procedures, that are used by domain expert to track thermal panels installations.
Research Data & Selected Areas
As mentioned, the best (and probably the only) solution to track down thermal panels is to use aerial images. Indeed, due to their nature, thermal panels are always visible on aerial images. Exceptions to this rule are unusual. In addition, aerial images are acquired regularly and a full set of orthomosaic can be easily obtained each five years (at least in Switzerland). For Geneva and Neuchâtel, it is not impossible to obtain a set of images each two years.
Nevertheless, using aerial images come with drawbacks. The main one is of course resolution (GSD). Aerial image sets used to compose orthomosaics are acquired to cover the whole territory. It follows that the resolution is limited. For a large amount of applications, the available resolution is sufficient. But for thermal panels, the resolution starts to become challenging.
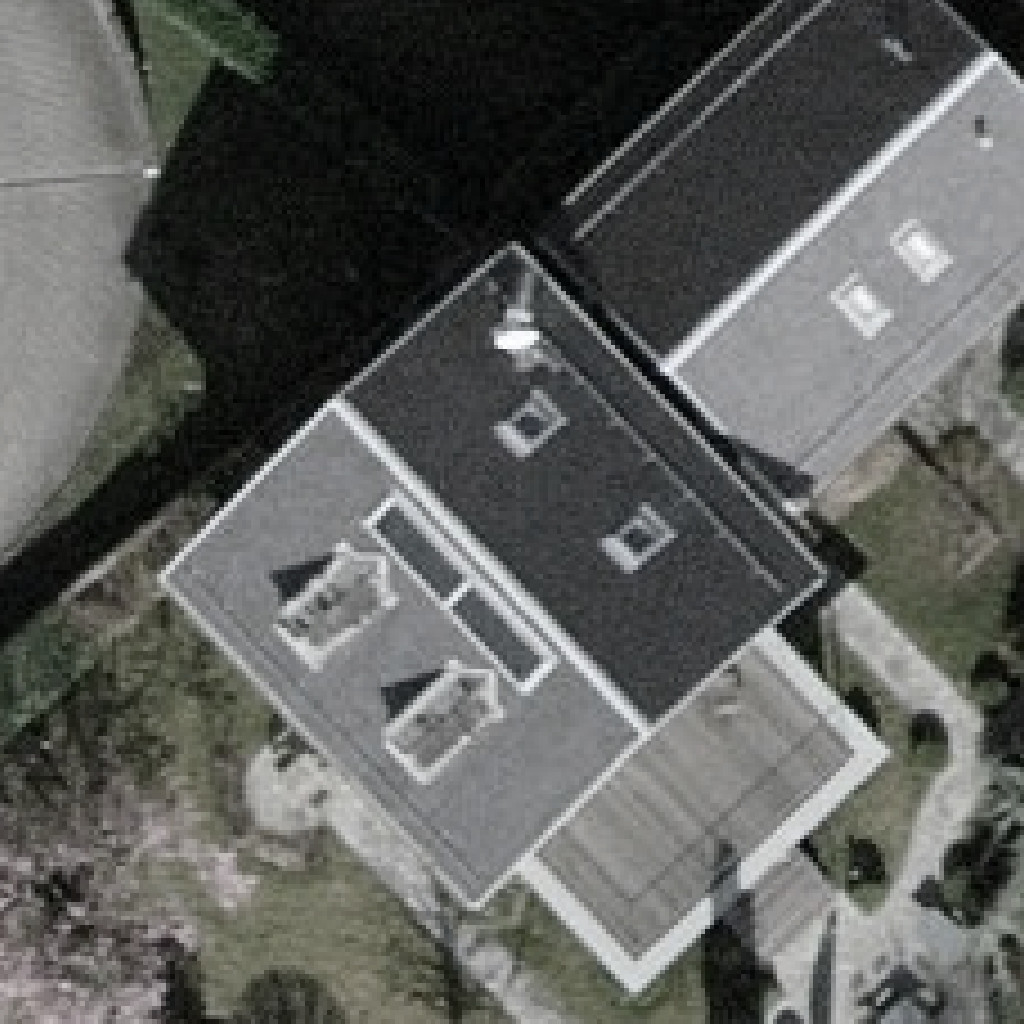
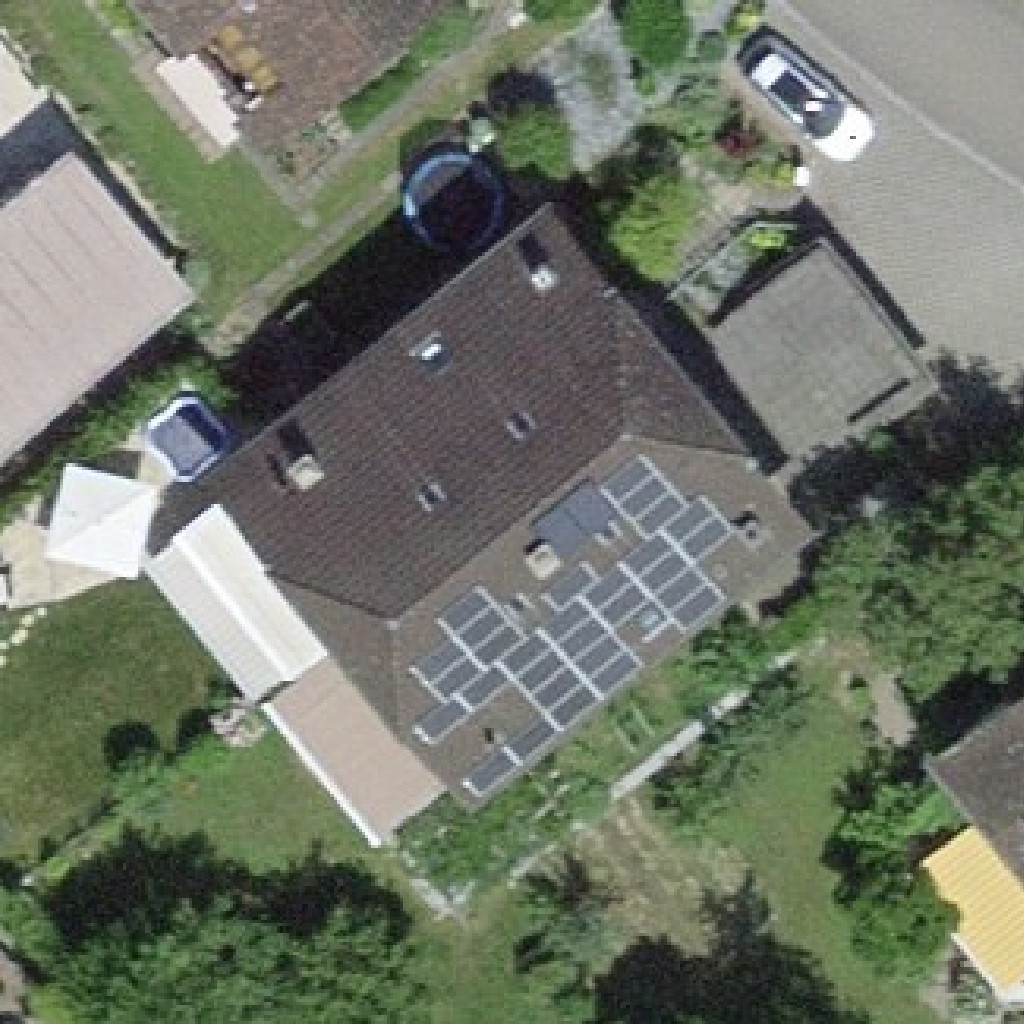
Illustration of the resolution at which thermal panels can be viewed on aerial images - Data : swisstopo, SITG (GSD ~ 10 cm/pixel)
Despite the resolution, aerial images are selected to train a deep learning network. Mainly SWISSIMAGE from swisstopo are considered for this research project. At the time, the 2020 version of the orthomosaic is considered for both Neuchâtel and Geneva.
For both cases, a test area is defined. On the side of Neuchâtel, a large test area is chosen in order to cover a large portion of the territory that mixes constructed zones and more rural ones. On the side of Geneva, the test area is defined by the domain expert and consists of a rectangular zone.
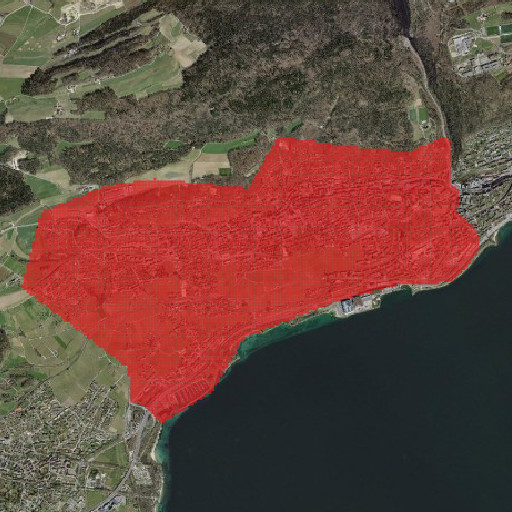
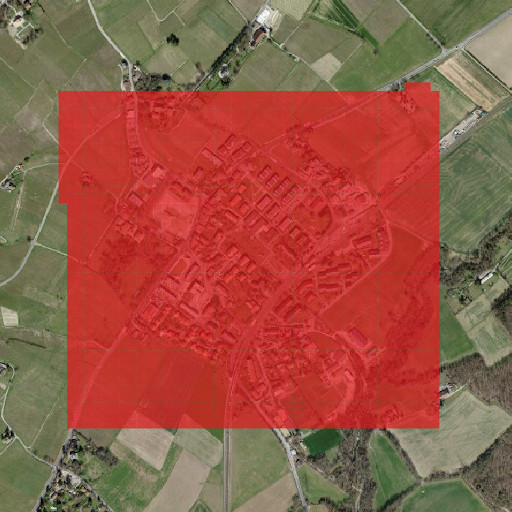
Illustration of the test areas defined on Neuchâtel (left) and Geneva (right) - Data : swisstopo
The research project is then only focusing on portion of territory to keep the scale realistic for such demonstrator according to the available time.
Deep Learning Model Initial Training
In this project, it is not possible to extract a ground truth, that is annotations on aerial images, from the domain expert databases. Thankfully, the FHNW, partner of the STDL, conducted some year ago annotations for thermal panels on the States of Aargau. The set consists of thousands of annotated tiles of 80x80m in size made on the SWISSIMAGE images set (2020). The annotation work was made by students of the FHNW and supervised by the D. Jordan scientists team.
Such data-set is exactly the required bootstrap data to train an initial deep learning model. The only constraint is coming from the fact that the ground truth is defined by the 80x80m wide tiles on which annotations are made.
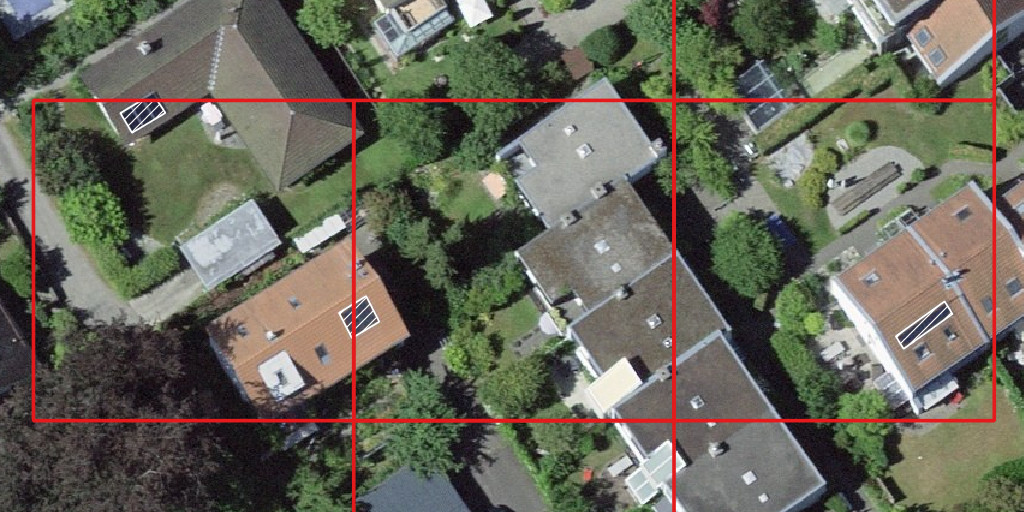
Illustration of the FHNW ground truth - Labels in white, tiles in red - Data : swisstopo, FHNW
Several training sessions are conducted in order to determine which sub-tiling system lead to the best performances scores. Due to the predefined ground truth, only sub-tiles of the 80x80m original tiles are possible. As a result, 80x80m, 40x40m and 26x26m tiles are considered for the network training.
In all training sessions, the results are quite stable around a F1-score of 0.8-0.85, with always a non-negligible proportion of false positives. The best results are obtained for the smaller tiles : 26x26m. It is unfortunate as small tiles comes with drawbacks. Indeed, using small tiles impose important tiling strategy to cover a large area. In addition, using small tiles also induce larger amount of cuts that have to be merged afterwards to create a usable geographical layer. Despite these drawbacks, as a demonstrator is desired, the performances are favored.
The following plot shows the precision, recall and F1-score obtained for the initial training using the data of the FHNW. These values are computed over the test set, that consists of 15% of the total data-set.
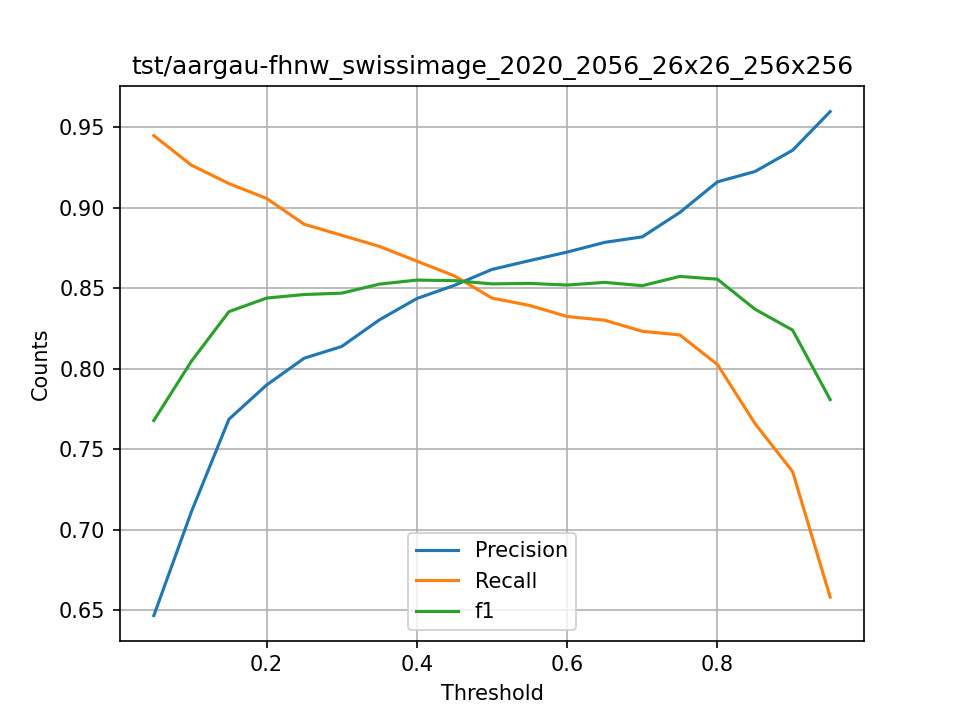
Scores obtained with the FHNW ground truth - Precision, Recall and F1-score
On the previous plot, the scores are all computed entity-wise and not pixel-wise. This choice is made to fit the main necessity of domain experts, which is to inventory thermal panel installations more than estimating their surfaces, which is a secondary goal. One can see that encouraging results are obtained, but one can also see that the F1-score plateau is not significantly marked, a sign that the model is not yet optimal, despite the large amount of data.
As we are working with domain experts, presenting F1-score according to threshold can be challenging and difficult to understand. During other research projects, it has been clear that efforts have to be put on our side to present the performances of our tools in a way that is informative and understandable by the domain exerts, in order to ensure a working collaboration and dialogue, without which, such research projects can be difficult to conduct.
It is the reason why an alternate representation of the performances are introduced. It shows the performances of the neural network in a more compact and readable way, focusing on elements that are interesting for the domain experts and their real-world necessities. The proposed plot is as follows :
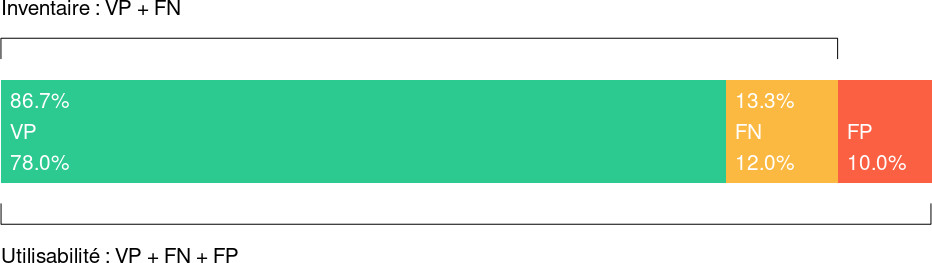
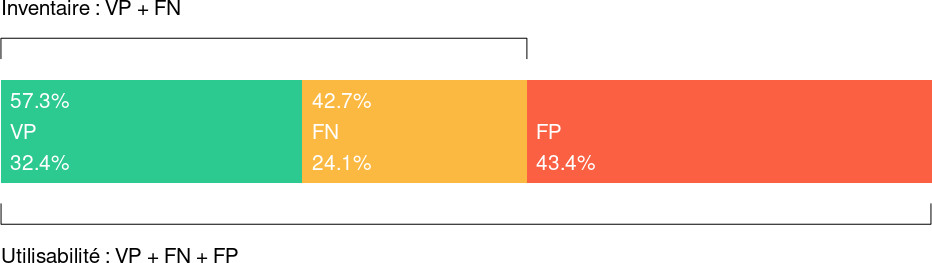
Simplified representation used with domain experts of the obtained scores - The green area is the true positives, the yellow one is false negatives and the red on is the false positive. The upper percentage give the inventory capacity, the lower one adding the false positive to the percentage.
The bar is containing three proportions : the true positives, the false negatives and the false positives. The two first proportions are grouped into one in order to represent the capacity of the network to create a reliable inventory. It shows the amount of thermal panels detected over their total amount (recall). The overall bar adds the proportion of false positive, that are seen by domain experts as pollution of the obtained inventory. Showing this proportions indicates to the domain experts, in a simple way, how usable the inventory is.
Assessment and Improvement of the Model
This section is split into two separated parts, one for the Geneva case and the other for the Neuchâtel one, as the chosen strategy is different. The case of Geneva, with a more direct approach (not considering the domain expert pre-existing database), is presented first.
Case of Geneva
In the case of Geneva, the choice is made to not consider existing databases and to proceed on detecting thermal panel installations directly on images to create an inventory that can then be assessed by the domain expert to extract reliable performance scores.
Assessment by the Domain Expert
In order to produce the predictions over the test area, in this case defined by the domain expert, the area is split into tiles with the chosen size. The tiles are then sent to the deep learning network in order to produce the predictions of thermal panel installations. The following image shows the tiling system over the test area :
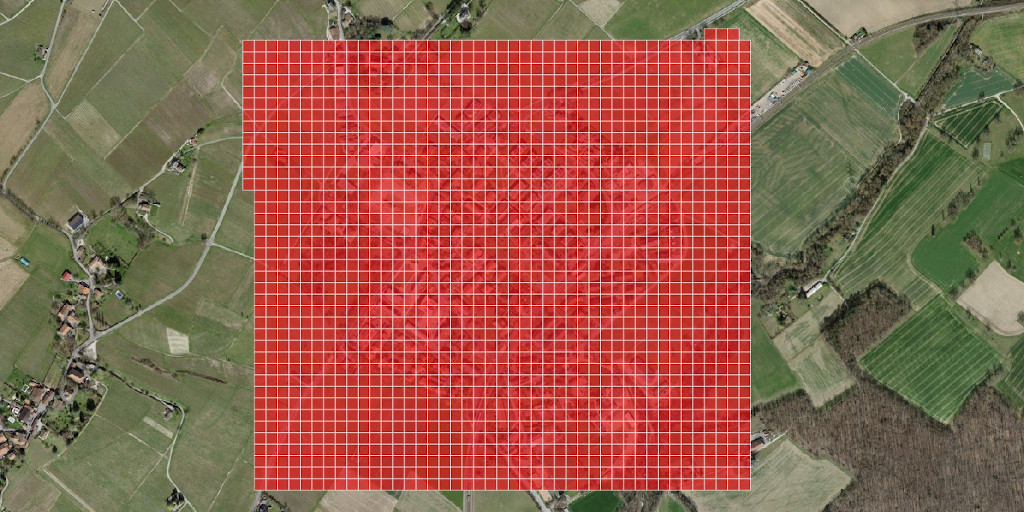
Illustration of the tiling system applied on the Geneva test area (26x26m tiles)
A set of tiles is obtained with predictions on them. The optimal threshold, deduced from the initial training on the FHNW data-set, is used to filter the predictions over the test area of Geneva. The tiles containing no prediction are removed by an automated process. The other tiles are associated with the predictions geographical footprints that and stored in a shapefile to keep the format simple and easy to exchange with the domain expert.
By defining a common language with the domain expert on how to validate the predictions, the shapefile containing the predictions are sent to the domain expert along with the aerial images on which predictions are made. The role of the domain expert is to assess the predictions to indicate, on the tiles containing at least a prediction, the true positives, the false positives and the false negatives.
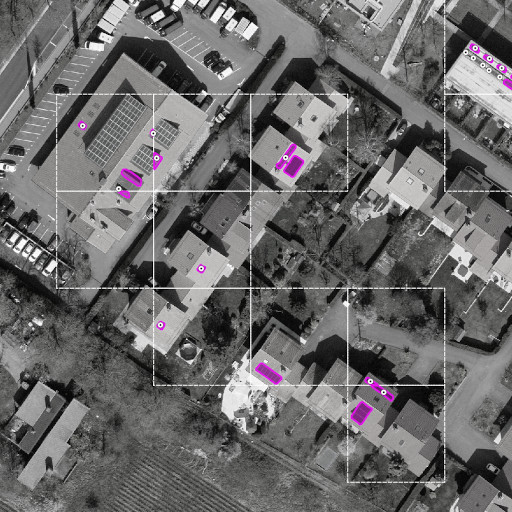
Illustration of the common language defined to assess the predictions - The domain expert simply puts a mark in the determined false positive and at the location of the false negative. The true positives are left untouched
By assessing the prediction with a domain expert, ensure that the obtained scores are reliable, as thermal panels are difficult to identify on the aerial image for a non expert. Without assessing the predictions through a domain expert would lead to unreliable scores.
Results
The assessment of the predictions made by the domain expert lead to the following results on the test area. A total of 89 tiles are formally certified by the domain expert with the following counts :
| Category | Count |
|---|---|
| TP | 47 |
| FP | 63 |
| FN | 35 |
On a total of 110 predictions on the certified tiles, 47 are true positives, 63 being false positives. A total of 35 missing predictions are pointed by the domain expert. It follows that 47 thermal panel installations are found over 47+35=82. This leads to the performances score for the initial deep learning over the Geneva test area model of :
| Score | Value |
|---|---|
| Precision | 0.43 |
| Recall | 0.57 |
| F1 | 0.49 |
From the inventory point of view, nearly 60% of the thermal panel installations are found by the initial deep learning model on the test area. This is clearly below the initial model, showing that the data-set are not sufficient to obtain stable results at this stage. The following plot shows the results presented in the simplified form :
Score obtained on Geneva with the initial deep learning model - Simple representation
Taking into account the large amount of false positives, the initial training is clearly not at the desired level to be usable by the domain expert to produce a reliable geographical layer of thermal panel installations. But these number are important, as they are certified by a domain expert, ensuring the ground truth used to assess the prediction is reliable.
Improvement of the Deep Learning Network
With the assessment made by the domain expert, reliable scores are obtained. In addition, as predictions are marked as correct or incorrect, with addition of missing thermal panel installations on the certified tiles, it was possible to create an extension to the ground truth. Indeed, driven by the corrections of the domain expert, new annotations are made on the certified tiles, including true positives and false negatives.
These annotations are made by STDL on the images used to produce the predictions. The predictions in themselves are not sufficiently reliable to be directly translated into labels, and the false negative have to be added anyway.
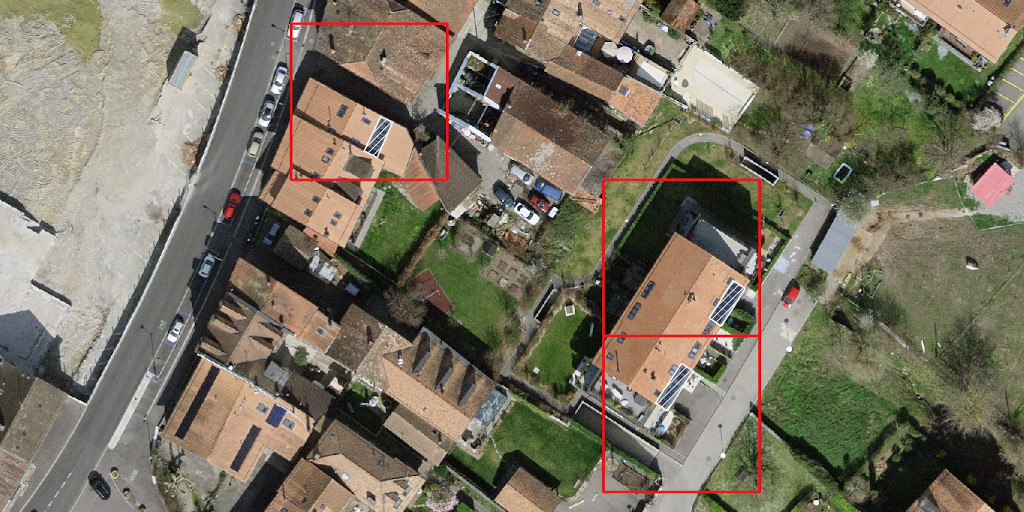
Annotations created on the Geneva area driven by the assessment of the domain expert - The labels are in white and the certified tiles in red
In the case of Geneva, the ground truth extension is made on the same images used to produce the prediction. As the number of certified tiles is low, a strategy is tested in order to improve the ground truth extension. The idea consist in looking along the time dimension. Indeed, in Switzerland, aerial images are acquired in a regular basis. It follows that a history of aerial images is available.
The time range from 2000 to 2020 is then considered in terms of the available images. For each set of images, the annotation created on the 2020 image set are transferred to the older images. This process is not straightforward, as each prediction have to be checked to certify that the thermal panel installation is there on older images. In addition, each tile has to be checked individually in order to check that no older thermal panel installation was there and destroyed before 2020.
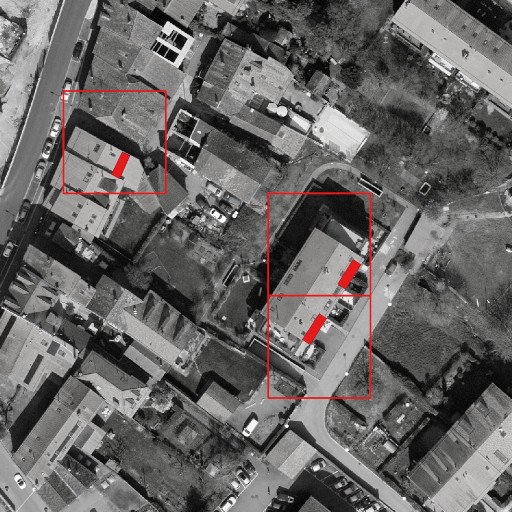
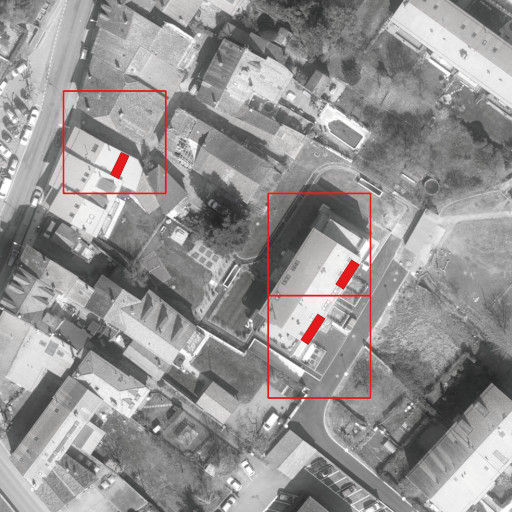
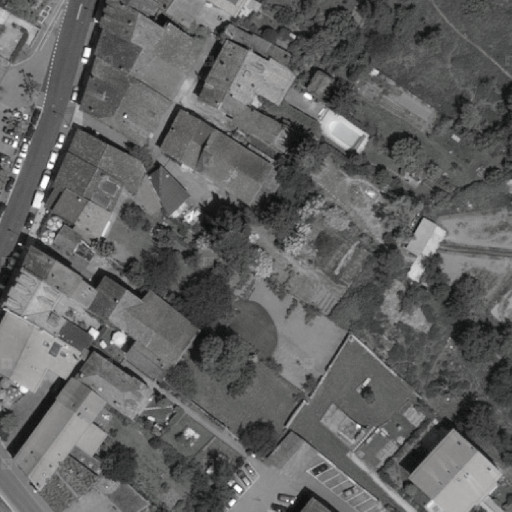
Illustration of the propagation of the ground truth along the time dimension - The image on the right illustrates the limit of the process
By doing this exploration along the time dimension, it was possible to increase the ground truth extracted from the assessment procedure made by the domain expert. From only 41 tiles and 64 annotations extracted using the initial test zone on the year 2020, 394 tiles and 623 annotations are obtained by considering the 2000 to 2020 time range for aerial images.
Considering the time dimension allows to better leverage the assessment made by the domain expert, despite the procedure is time-consuming. One has to keep in mind that such process is not ideal, as the same examples are simply repeated. It has some interest as it allows showing the same examples under different condition of luminosity and orientation, which can improve the deep learning model detection ability.
With this new ground truth, it was possible to re-train the initial network. This was done using both the FHNW initial ground truth and the annotations made on Geneva. The following results are obtained, shown using the simple representation :
Scores obtained on Geneva with consideration of the new annotations certified by the domain expert - Simple representation
This plot shows the results on the test set limited to the Geneva test area. Again, the test set contains 15% of the ground truth, and limiting it to the area of Geneva leads to only several tens of tiles. This amount of tiles is quite low to conclude on the encouraging results obtained with the extended ground truth. This is reinforced by the lack of stability already observed in the previous results.
Conclusion
It is clear that the initial deep learning model, trained with the FHNW ground truth is not satisfying for a real-world usage by domain experts. Its ability to produce an inventory is not optimal, and the amount of false positives make the produced geographical layer difficult to use.
Nevertheless, reliable score are obtained and can be trusted on the Geneva area thanks to the domain expert assessment. In addition, the assessment made by the domain expert, as it also included the false negatives (at least on the considered tiles), allowed to extend the ground truth. The extension of the ground truth along the time dimension allows taking advantage of the work of the domain expert as much as possible, leading to more certified tiles.
The new training allowed to improve the situation on the Geneva area quite clearly. The inventory capacity of the deep learning model went from around 60% to around 80%. The amount of false positives is also drastically reduced. These are encouraging results, but the small amount of new tiles and the multiplication of the same examples along the time dimension has to lead us to a certain care, especially due to the instabilities of the results.
Case of Neuchâtel
The case of Neuchâtel is clearly more complex than the case of Geneva. In this case, the database of the domain expert is considered in order to try to link the predictions with the entries of the existing database. This choice is made to demonstrate the ability to integrate data science technology in existing pipeline, in order to avoid creating disruptive effect.
Processing and Linkage with the Domain Expert Database
In the first stage, the domain expert database is analyzed in order to determine the best solution to link the prediction made by the deep learning model and the entries of the database.
The database in itself is a simple Excel sheet, with each line corresponding to a subsidy query that goes along the construction permit. Subsidies are provided by the authorities to promote deployment of the renewable energy. This is also a reason explaining the necessity for authorities to track down the construction of thermal panel installations.
The major issue with the database is the localization of the thermal panels installation. Along the years, the database being quite old, different ways of localizing the installation were used. Three different localization systems are then available : the postal addresses, the geographical coordinate and the EGID (federal building identifier). Unfortunately, these standards are mixed, and all entries are localized differently. Sometimes only one localization is available, sometimes two or three. In some cases, the different localization information are not consistent, which lead to contradictions in the installation position.
For some entries, the localization information is also incorrect or only approximate, which can lead to difficulties to associate a geo-referenced prediction to an entry of the database.
For these reason, lots of efforts are put on the pre-processing of the database to make the link between prediction and entries as reliable as possible. The RegBL (federal register of buildings and dwellings) is used to assess the EGID and the postal addresses and to track down contradiction. In addition, the post addresses of the State of Neuchâtel is also considered to match addresses with geographical positions for the same reason.
By doing this, many potential positions are extracted for each entry of the database. This allows to assess the contradiction in order to retain the most probable and reliable localization for each entry of the database. Of course, in many cases, the assessment is quite weak as the amount of information on localization is low (this is especially the case for older installation, the new one being localized in a much more reliable manner using the EGID).
At the end of this complex and time-consuming task, almost all entries of the database are associated with a geographical position. This allows to match predictions, that are geographically localized, to the most probable entry of the database. This process is important as it allows the domain expert to not only have a geographical layer of the thermal panel installation but to have also the link with its pre-existing database. This allows to put into perspective prediction and database to track down construction and destruction of installations along the time dimension.
Assessment by the Domain Expert
After pre-processing of the domain expert database, a region of Neuchâtel state is defined. A tiling strategy is made to translate the defined area in tiles of the appropriated size according to the initial training of the deep learning model. Predictions are then made on each of the tiles. Again, the optimal threshold is selected according to the initial training to filter the predictions made on the test area.
At this stage, the procedure differ from the case of Geneva. Here, tiles are not filtered based on their content of prediction or not. The database is considered, after its pre-processing, and the predictions are linked to the optimal entry according to its best localization. As a result, a set of predictions linked to a specific entry of the database is obtained. The other predictions are simply discarded for this specific assessment procedure.
In order to serve as much as possible the interests of the domain expert, a specific assessment procedure is set. This is set to allow to assess the prediction on one side and to help the domain expert to correct the bad localization of the thermal panel installation in his database on the other side. The chosen approach is based on a dictionary of GeoTIFF images on which the prediction are shown and on which additional information are specified to help the domain expert to assess the localization provided by the database.
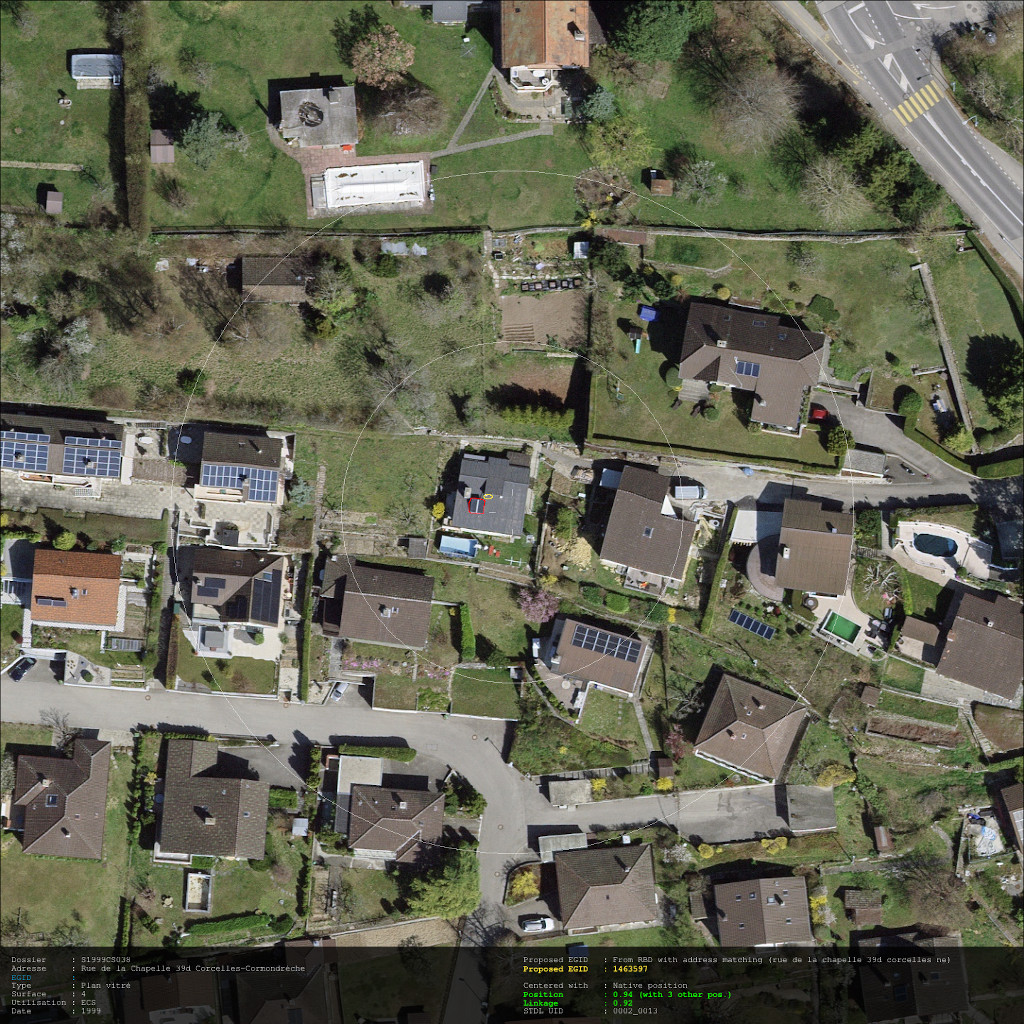
Illustration of one page of the dictionary corresponding to one database entry - For each entry, such image is provided, showing information on the entry, its localization consistency and the prediction made by the model - Each image is a geo-referenced TIFF
The dictionary is made of a GeoTIFF per prediction that is linked with a unique entry of the database. In addition to the prediction geometry drawn on the image, basic information on the linked database entry is provided. The optimal localization (between post addresses, coordinates or EGID) used to link the prediction and the entry of the database is also indicated to help the domain expert to understand the link. Information about the estimated quality of the localization of the thermal panel installation is also provided.
This quality indicator is based on the consistency of the multiple location information (post address, coordinates and EGID). The more consistent they are, the better the localization is considered. In case of a potential bad localization, the domain expert is invited to check the entry of the database to correct the position.
In parallel, a simple Excel file is set and filled by the domain expert along the procedure. It allows setting the corrected positions, when required, and to indicate if the prediction is correct and correctly linked to the database entry. This process allows setting a win-win strategy where incorrectly located installation are treated on the side of the database and the prediction is assessed for the correct localization.
The procedure for the domain expert consists then only to parse a sequence of images on which all the information are shown and to fill columns in the assessment Excel sheet. This allows to assess quickly and efficiently the prediction while correcting the inconsistency in the database.
Results
Thanks to the assessment procedure, part of the predictions are certified by the domain expert. This allows to compute scores on the capacity of the initial deep learning model to compute inventory of thermal panel installations. Unfortunately, this assessment procedure does not allow the computation of the formal scores, as the false negative are not considered. This is the main drawback coming from the fact that we work in parallel with the domain expert database.
On the 354 predictions linked to the database, 316 corresponds to correctly localized entries of the database. On the 316 correct entries of the database, the domain expert reported 255 visible installation. This shows that many installations, present in the database through an entry, are not visible in the reality. With these numbers, one can deduce that 61 installations are reported in the database through paper work but cannot be found in the real world. The explanation is probably complex, but this shows how difficult it is to keep a database of installation up to date with the reality.
Without a formal historical analysis, it is not possible to determine what happened to these missing installation. For some of them, one needs to consider the natural cycle of life of such installations. Indeed, thermal panel have a determined lifetime and need to be replaced or decommissioned. It is also possible that for some of them, the construction permit was asked but without leading to the actual construction of a thermal panel installation. This case is expected to be less usual.
Back to the score of the initial deep learning model, on the 255 visible installation, the domain expert determined that 204 are correctly detected by the model. This lead to an inventory capacity of 0.8 which remains in the initial model scores. It is interesting to observe that the initial model scores seem to hold in the case of Neuchâtel but not in the previous case of Geneva. Indeed, on Geneva, the inventory capacity drop to 0.6.
Improvement of the Deep Learning Network
With the assessment made by the domain expert, despite false negatives are not considered, it was possible to increase the ground truth with new annotation on the test area of Neuchâtel.
The procedure starts by isolating all prediction that are marked as correct (true positive) by the domain expert. A tiling system is then set to cover the entire test area with size fitting the initial choices. The certified true positive are then manually processed to create a proper annotation, as the prediction are not reliable enough. The certifications made by the domain expert are sufficiently clear for a data scientist to do this task autonomously.
The last stage consist in validating the tiles containing a new annotation. This part is the most complex one, as the data scientist has to work autonomously. The tiles containing a new annotation can only be validated, and enter the ground-truth, if and only if no other ambiguous element appear in the validated tiles. If any ambiguities arise for a tile, it needs to be dropped and not considered for the ground truth. In the case of Neuchâtel a few tiles are then removed for this reason.
With this procedure, 272 new annotation are added to the ground truth on 254 tiles. These annotations, as for Geneva, are certified by a domain expert, providing a reliable ground truth. With this new set of annotation, and considering the new annotation made in the case of Geneva, it is possible to conduct a new training of the deep learning model. For this last training, the full ground truth is considered, with the FHNW annotations and those coming from the domain experts of Geneva and Neuchâtel.
The following plot gives an overall simple representation of the obtained results :
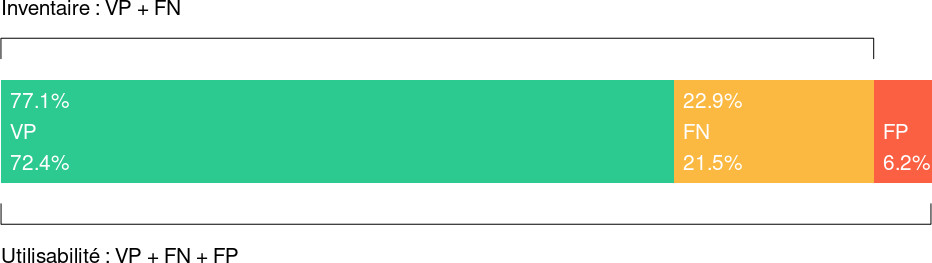
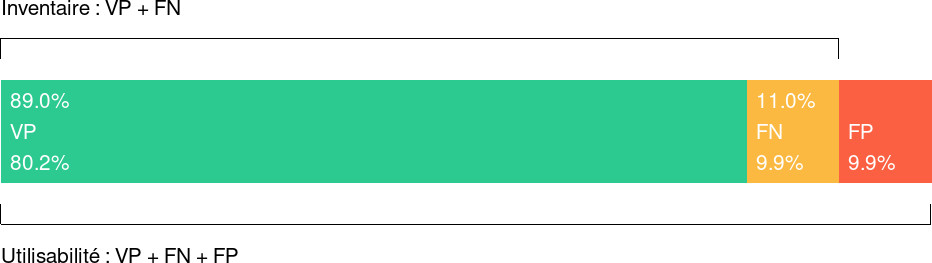
Score obtained using all the available ground truth, including FHNW, Geneva and Neuchâtel - Simple representation
On the test set, an F1-score of 0.82 is obtained, which is slightly worse that for the initial training (0.85). On the overall, one can also sees that the inventory capacity is decreased while the amount of false positive is reduced. Again, one can here sees the instabilities of the results, showing that the used data is not sufficient or not enough well suited for such task.
One can see on this following plots, the simple representation of the score reduced only the Geneva and Neuchâtel areas :
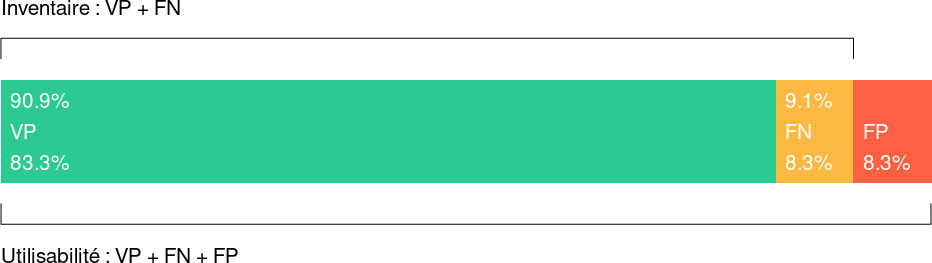
Score obtained restricted to the Geneva (test set) - Simple representation
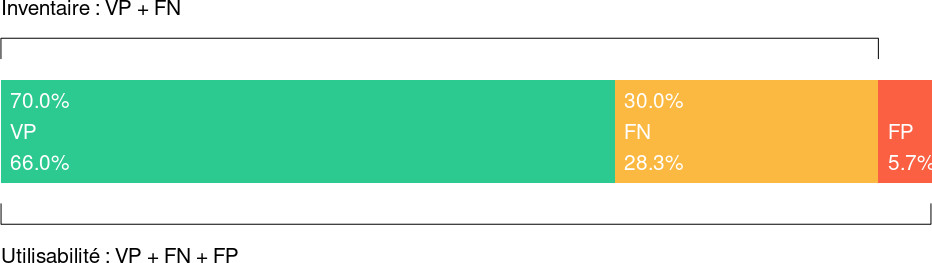
Score obtained restricted to the Neuchâtel (test set) - Simple representation
One has to take into account that restricting the score to such area leads to very few prediction, leading to poor statistics. It is nevertheless clear that the results on the Neuchâtel restriction demonstrate the instabilities observed all along the project. On Neuchâtel, choosing a different threshold could lead to a better inventory capacity, but the fact that the threshold needs to be adapted according to the situation shows that the model was not able to generalise.
It is most likely that the nature of the objects, its similarity with other objects and the resolution of the images play a central role in the lack of generalisation. As a conclusion, detecting thermal panels needs higher resolution in order for the model to be able to extract more reliable features from the object instead of relying only on the situation of the object.
Conclusion
In the case of Neuchâtel, the procedure is more complex, as the database is considered. The work on the database is time-consuming and the linkage of the predictions with the entries of the database is not straightforward, mainly due to the inconsistencies on thermal panel installation localization.
In addition, considering the database lead it to be the main point of view from which the prediction are analyzed, assessed and understood. It offers a very interesting point of view as it allows assessing the synchronization between the database and the current state of the thermal panel installations deployment. Nevertheless, such point of view also introduce drawback, as it does not allow to directly assess the false negative and only part of the false positive. This lead to intermediate scores, that are more focused on the database-reality synchronization than the performances of the deep learning model.
It is then clearly demonstrated that a deep learning model can be interfaced with an existing database to ensure processes continuity with the introduction of new technologies in the territory management. It shows that new methods can be introduced without requiring to abandon the previous processes, which is always complicated and undesired.
On the initial deep learning model assessment, with an inventory capacity of around 0.85 (recall), one can observe a difference between Neuchâtel and Geneva. Indeed, in Geneva, the recall dropped to around 0.6 while it was more around 0.8 in the Neuchâtel case. A possible explanation is the similarity between the Aargau (used as to train the initial deep learning model) and Neuchâtel in terms of geography. The case of Geneva is more urban than these two others. This confirms the instabilities already observed and seems to indicate that thermal panels remains a complex object to detect at this stage considering the available data.
Conclusion and Perspectives
As a main conclusion, this project, performed in two stage with Geneva and Neuchâtel states, is a complex task. The nature of the object of interest is the main source of difficulty.
The current available aerial images made the detection of such object possible, but the resolution of the images (GSD) makes the task very difficult. Indeed, as mentioned, the thermal panel installations visible on the image are at the limit of resolution. This forces the deep learning model to learn more with the context than with the object features themselves.
To add complexity, thermal panels appear very alike electrical panels on images, leading to a major source of confusion. The fact that the deep learning model is relying more on context than on object features lead the electrical panel to be reported as a thermal one, reducing the efficiency of inventory, leading to large amount of false positive.
Despite that, interesting results are obtained and cannot lead to the conclusion that inventory such object is currently impossible. It remains very challenging, but data science can already bring help in the tracking and surveillance of the thermal panel installations.
The collaboration with the domain experts is here a necessity. Indeed, such installations, especially with the image resolution, are extremely complex to confirm as such (mainly due to the confusion with electrical panels and other roof elements). Even for the domain expert, determining if a prediction is a true positive or not is challenging and time-consuming. Without the help of domain experts, data scientists are not able to tackle such problem.
Another positive outcome is the demonstration that data science can be interfaced smoothly with existing processes. This is shown with the Neuchâtel case, where the predictions can instantly be linked to the entries of the pre-existing domain expert database. This eases the domain expert assessment procedure and can also participate to assess the synchronization between the database and the reality.
As a final word, the obtained deep learning model is not formally able to enter the management of the territory. It is demonstrated that the nature of the object and the available data makes the model unstable from a situation to another. This shows that the current data available is not formally enough to lead to the production of a fully working prototype able to satisfy the specifications of the domain experts. Nevertheless, such model can already perform pre-processes to ease the work of domain expert in the complex task of tracking the deployment of thermal energy generators on the Swiss territory.